Every month Samuel Pearce, one of the CORE developers, collects the CORE statistics – perhaps a boring task, but useful for us to know where we stand as a service. A very brief report of the accumulative statistics of all years that CORE operates as a project, 2011 – 2015, are as follows.
Users can retrieve from CORE,
- 25,363,829 metadata records and
- 2,954,141 open access full-text records,
from 689 repositories (institutional and subject) and 5,488 open access journals. In addition, 122 users have access to the CORE API.
In the playful Christmas spirit we attempted this time to have some fun with the statistics.
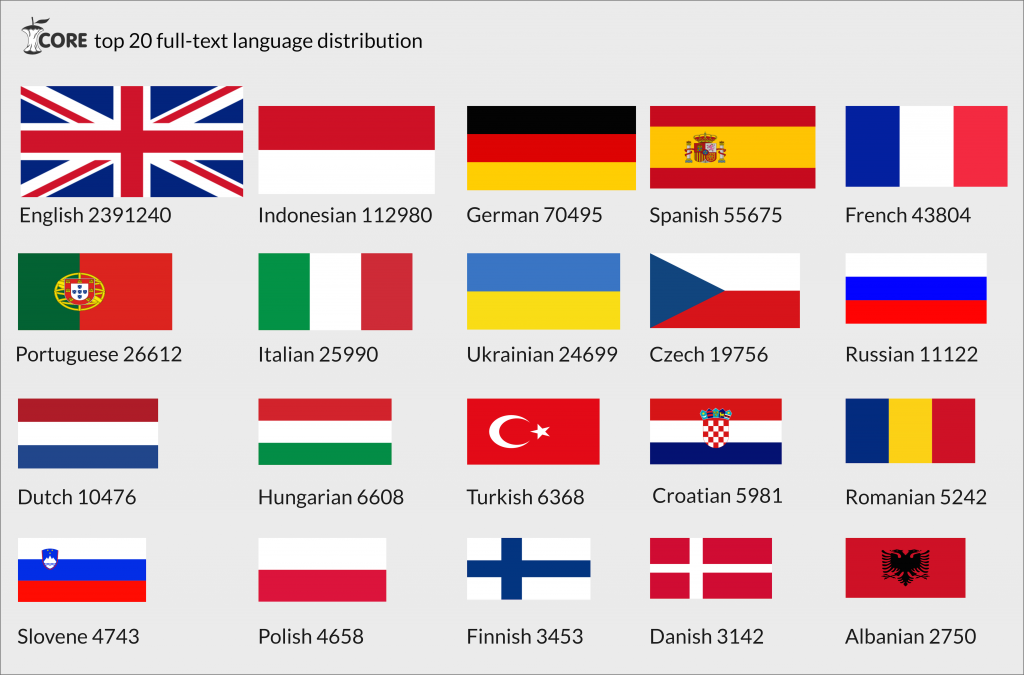
Since we harvest outputs in other languages than English, we created a top 20 list of the languages that appear in CORE’s full-text manuscripts.
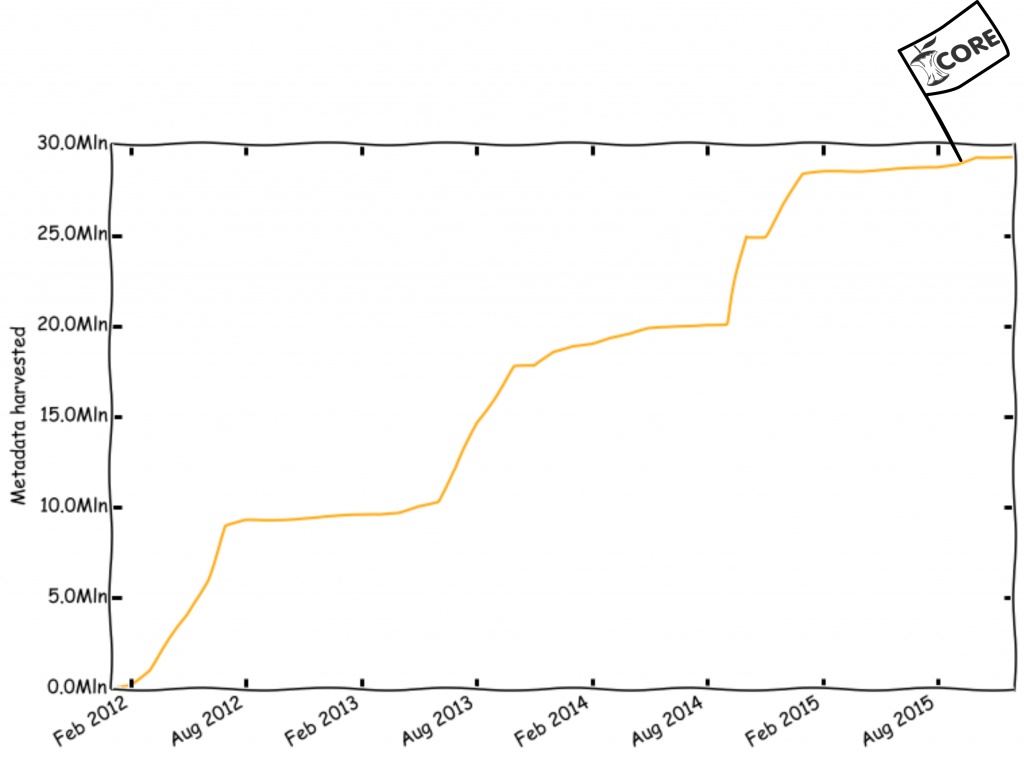
We also investigated how much we have progressed in the amount of the harvested metadata.
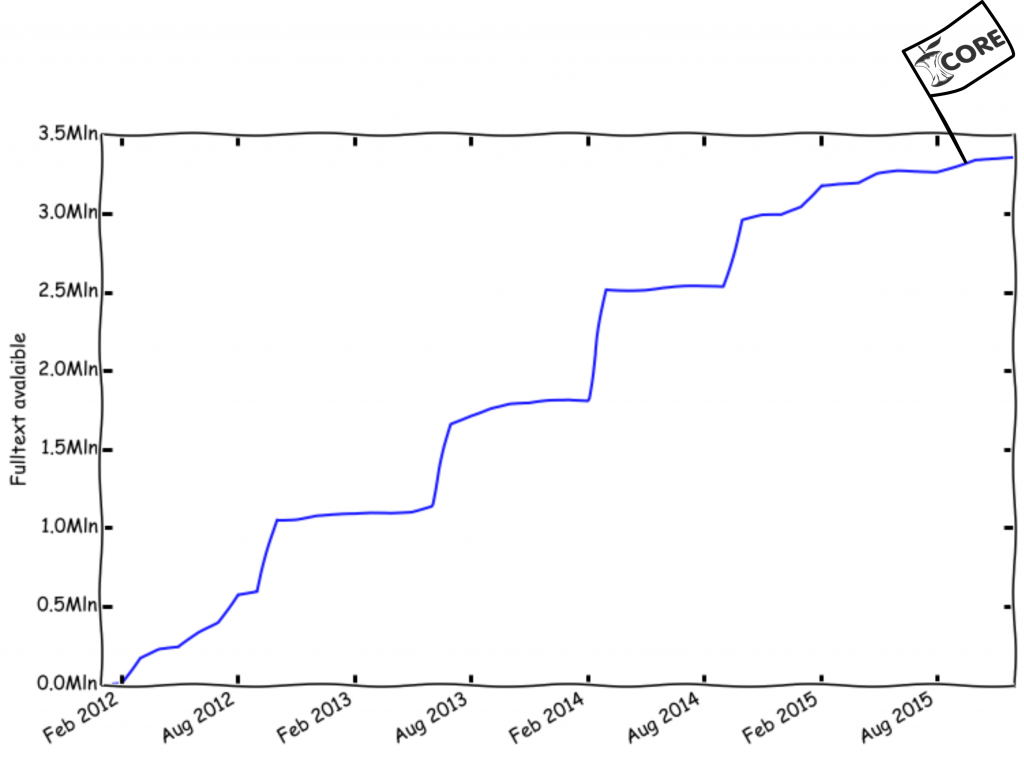
And the amount of full-text we have in our collection.

You may have noticed that the numbers in the graphs do not exactly match the numbers presented above. This is due to many reasons; for example during the harvesting process CORE retrieves either records with different types of inconsistencies or duplicates that we do not count in the “official” CORE collection. In addition, the numbers in the graphs include the amount of deleted or disabled records by the source repository. Therefore, the graphs illustrate the numbers that we actually harvest in CORE (what we have in our database), while the records that we provide via our search engine have been filtered and thus they are a bit smaller.
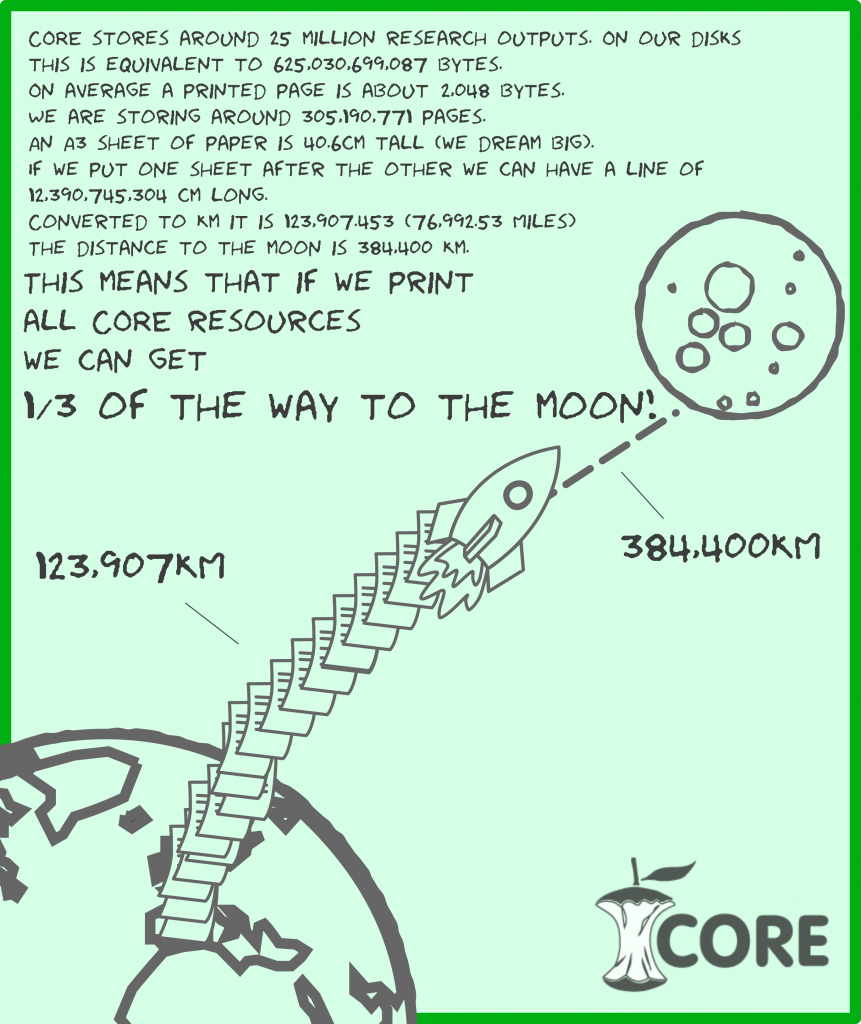
Finally, we calculated where CORE’s collection would take us if we had printed all the full-text from our database in a A3 page. We discovered that all this paper would take us 1/3 of the way to the moon.
Our next mission is to collect more full-text, enough to take us to the moon!
Merry Christmas!
*Note: Special thanks to Matteo Cancellieri for creating the images and the graphs.


