As CORE marks 15 years of supporting open scholarly infrastructure, we’re launching a short educational series to help repository managers make the most of the CORE Dashboard. Each instalment will take you through one area of the dashboard, unpack what the data means, and explain how it can support visibility, quality, and compliance goals.
We start with the Overview tab the first thing you see when you log into the dashboard, and the quickest way to understand how your repository is represented in CORE.
Highlights
What the Overview Tab Shows You
The Overview tab provides a high-level snapshot of your repository as it appears in CORE. This includes:
1. General Information
Right at the top, you’ll find the General information panel. Here CORE displays:
- the number of metadata records indexed from your repository
- the number of full texts harvested
- and how these have grown over time
It’s not unusual to see small differences between these numbers and what you report internally. This typically happens when some records aren’t exposed correctly via your OAI‑PMH endpoint, making them invisible to external services like CORE. Ensuring OAI-PMH compliance as outlined in the CORE Data Provider’s Guide helps maintain consistency and visibility.
If we detect any indexing issues, you’ll find details on the Indexing status tab.

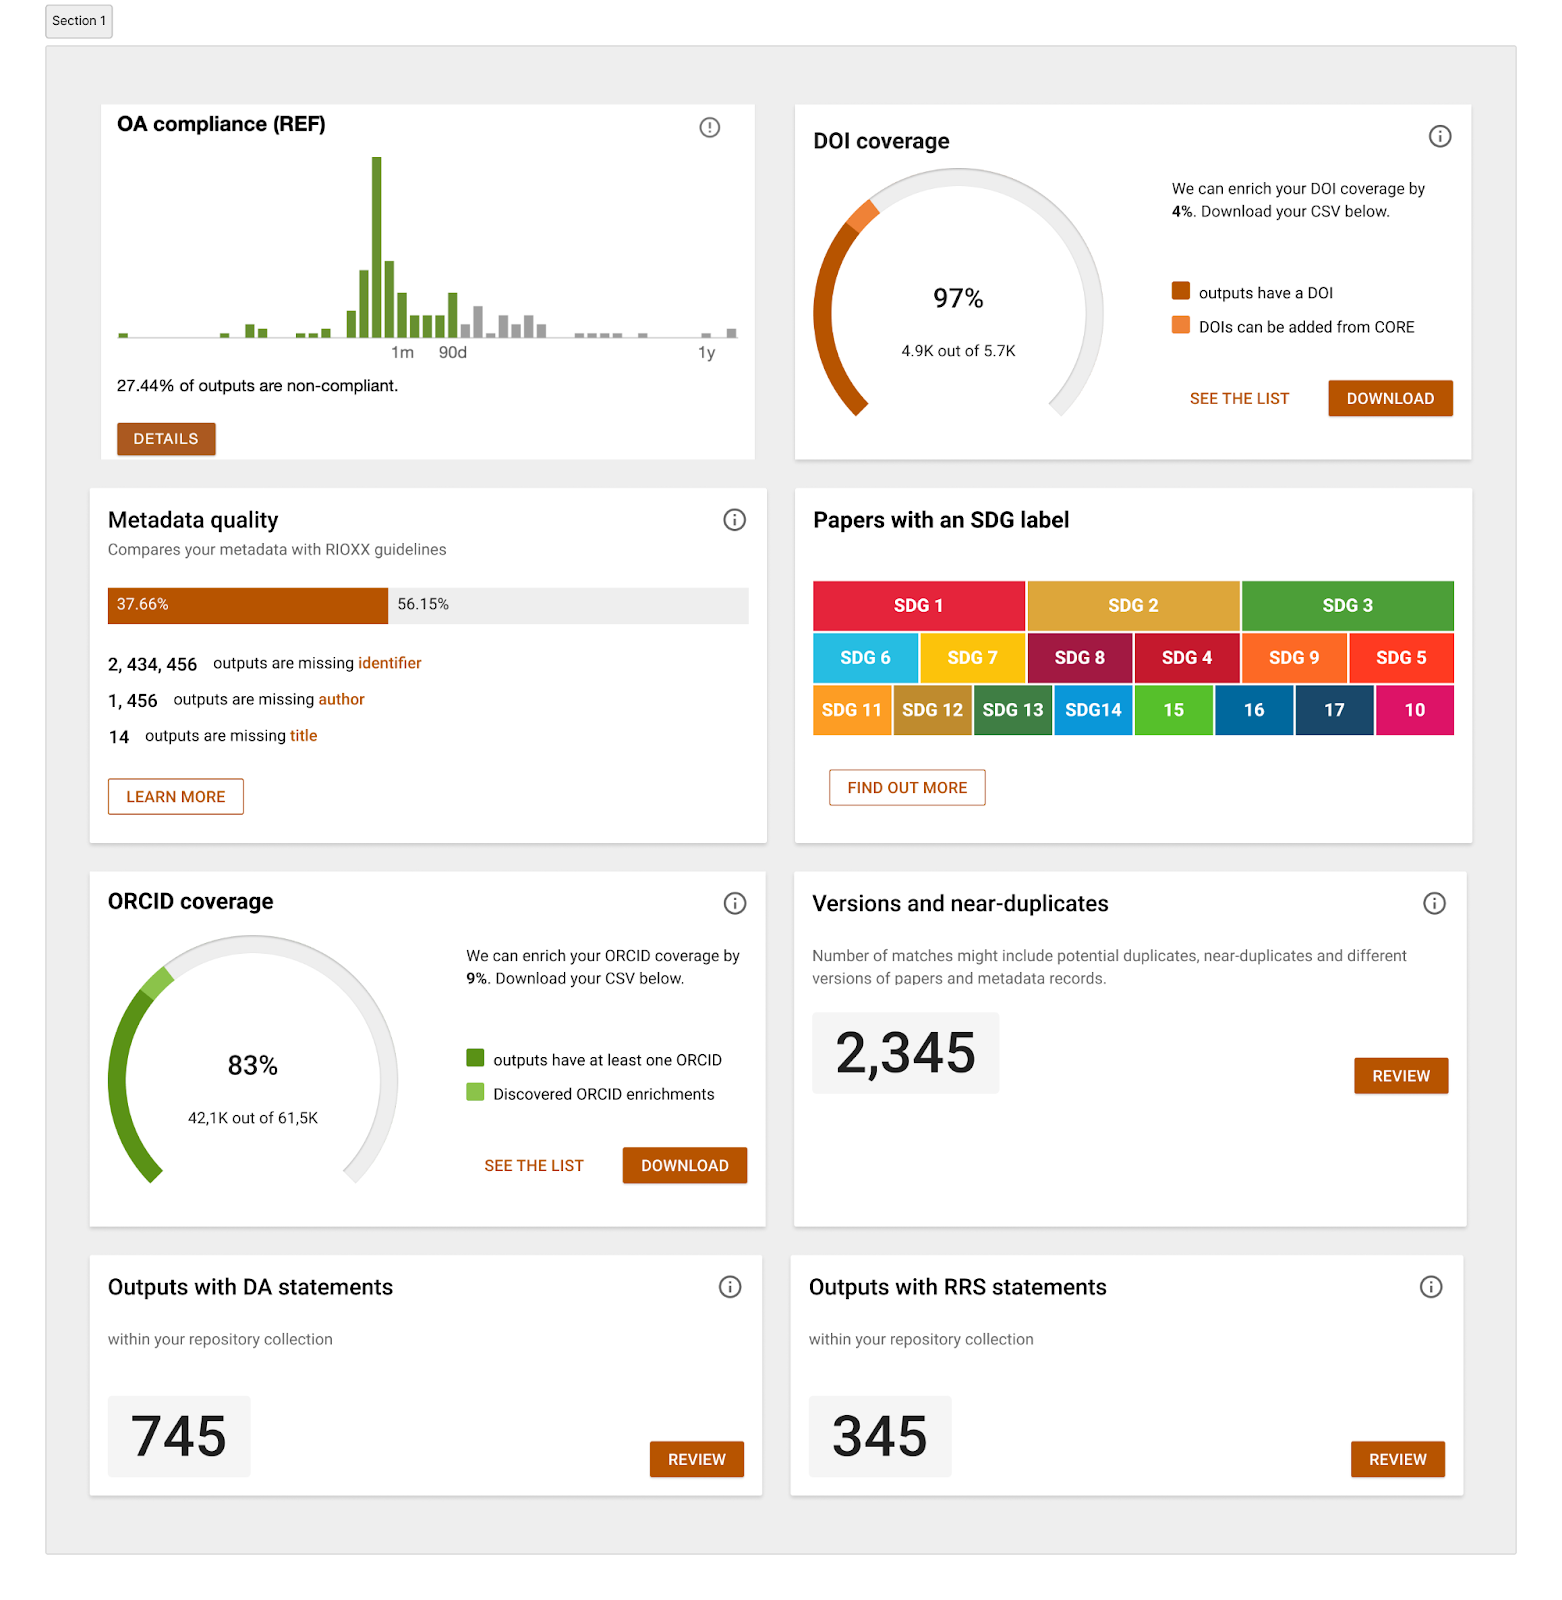
2. Summary Widgets: Your Dashboard at a Glance
Below the General information panel, a set of summary widgets highlights key metrics pulled from across the dashboard. These widgets give you quick insight into:
- OA compliance (REF)
- Metadata quality (RIOXX)
- DOI coverage
- Papers with an SDG label
- ORCID coverage
- Versions and near-duplicates
- Outputs with Data Availability Statements
- Outputs with Research Reproducibility Statements
Each widget acts as a preview and a shortcut to more detailed statistics in its respective tab.
Coming Up Next in This Series
Over the next few posts, we’ll explore each of these dashboard areas in more detail. Our aim is to help repositories understand not only what the data shows, but how it can be applied to strengthen reporting, compliance, research visibility, and metadata quality.